
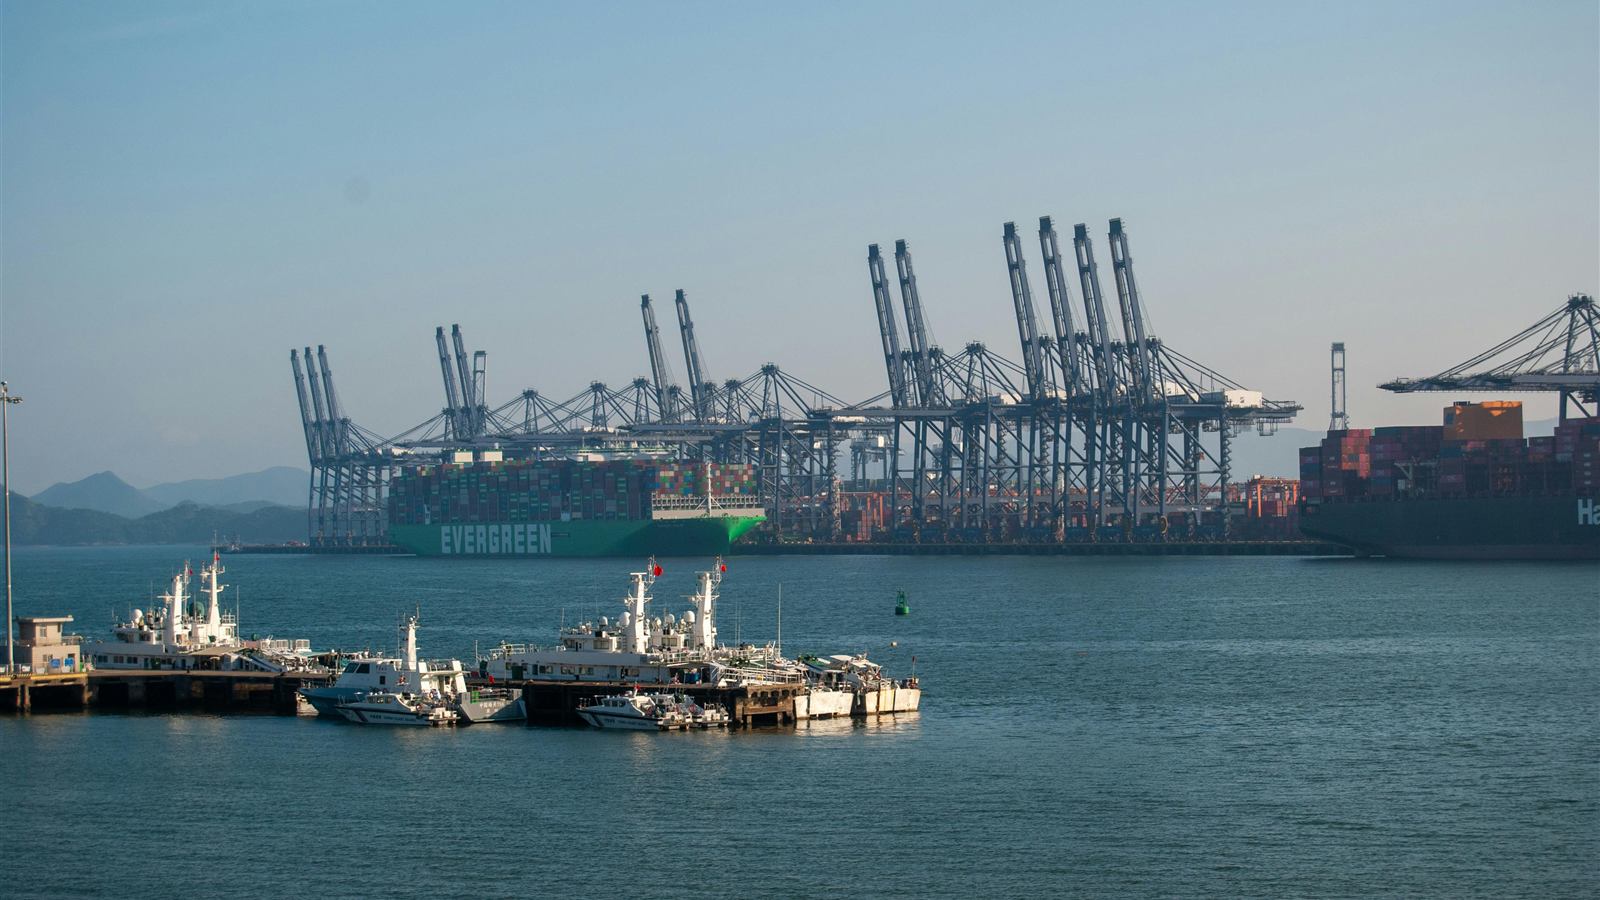
Headline growth does not translate directly into freight rates or capacity. The useful signal is the composition: general trade remained the largest share, bonded logistics expanded quickly and private enterprises continued to drive most of the city's trade.
What the data shows
Shenzhen reported RMB 3.42 trillion in total imports and exports for January through July 2026, an increase of 32.8% from the same period a year earlier. Exports reached RMB 1.77 trillion and imports RMB 1.65 trillion, according to data published by the city and attributed to Shenzhen Customs.
The trade-method mix is important. General trade reached RMB 1.75 trillion, or 51% of the total. Bonded logistics reached RMB 1.04 trillion, accounting for 30.5%, while processing trade reached RMB 619.4 billion.
Reading the shift
Private enterprises remained the largest group, with RMB 2.52 trillion in imports and exports and a 73.7% share. This matters operationally because Shenzhen's trade base is not limited to a small group of large manufacturers; it includes a broad network of exporters, importers and cross-border operators.
The city's top trade partners included Hong Kong, ASEAN and Taiwan, while official data also reported growth with the European Union, United States, Japan, South Korea, India, Switzerland and Australia. The pattern supports a diversified view of Shenzhen's international trade links.
Operating takeaway
These figures should not be used as a freight-price forecast. Capacity and rates move by lane, mode, season, equipment and carrier decisions. City trade data is better used to identify market direction and the importance of bonded, general-trade and multi-market operating capabilities.
For an individual shipment, the decision still begins with product description, packed dimensions and weight, origin supplier locations, destination postcode, required date, customs arrangement and final delivery conditions. Macro data provides context; cargo data determines the route.
VERIFIED SOURCES